


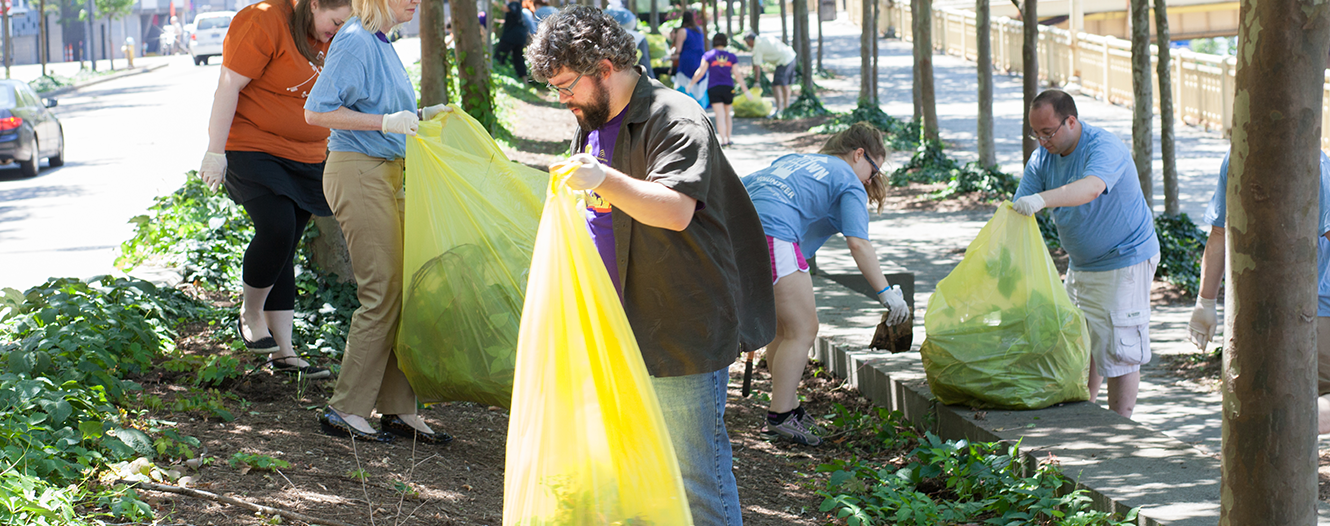
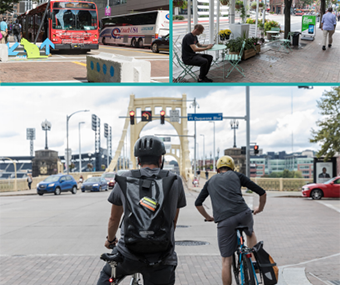
VOLUNTEER IN DOWNTOWN
Get out and about while working on projects that help create a more vibrant and beautiful Downtown.
LEARN MORE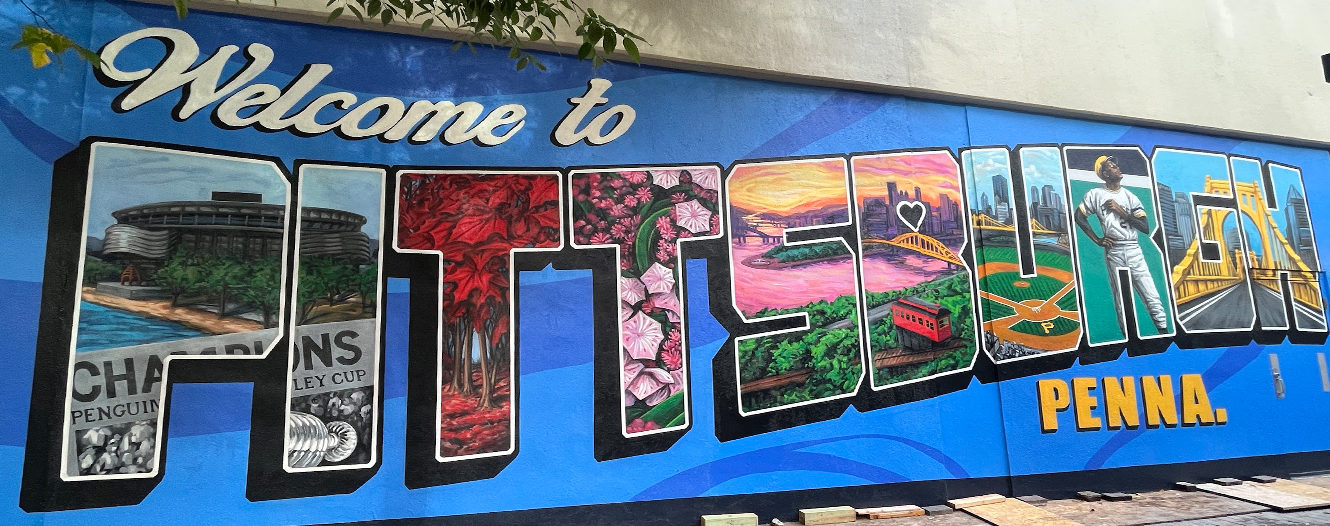
Welcome to Downtown Pittsburgh
BUSINESS DIRECTORY
Bring Your Kids to ‘Tahn
Wednesday, April 24, 2024
Thursday, April 25th is Bring Your Kids to Work Day! We’re sure a day in the office will be
…READ MORE
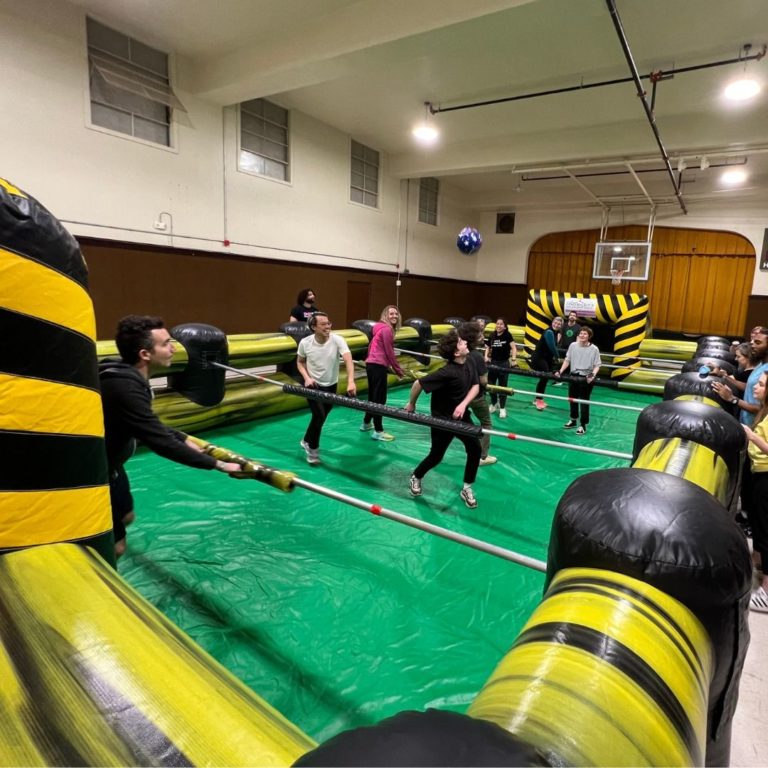
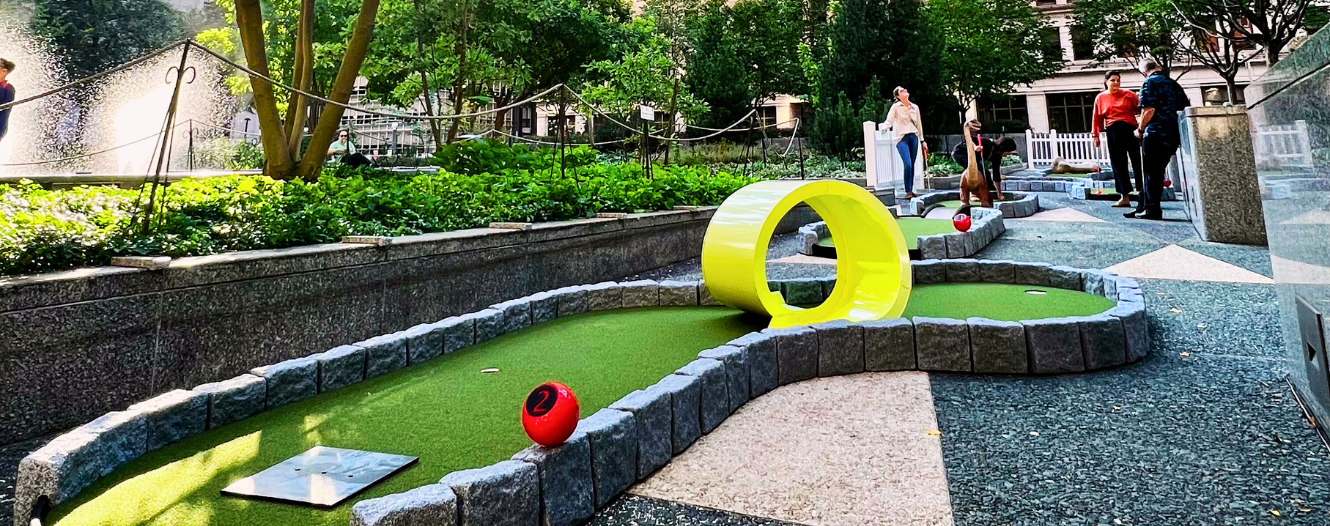
Compete for a Cause: Foosball Frenzy is Coming to Market Square
Thursday, April 18, 2024
Do you have what it takes to be a Human Foosball Champion? Compete to win & support youth programming
…READ MORE
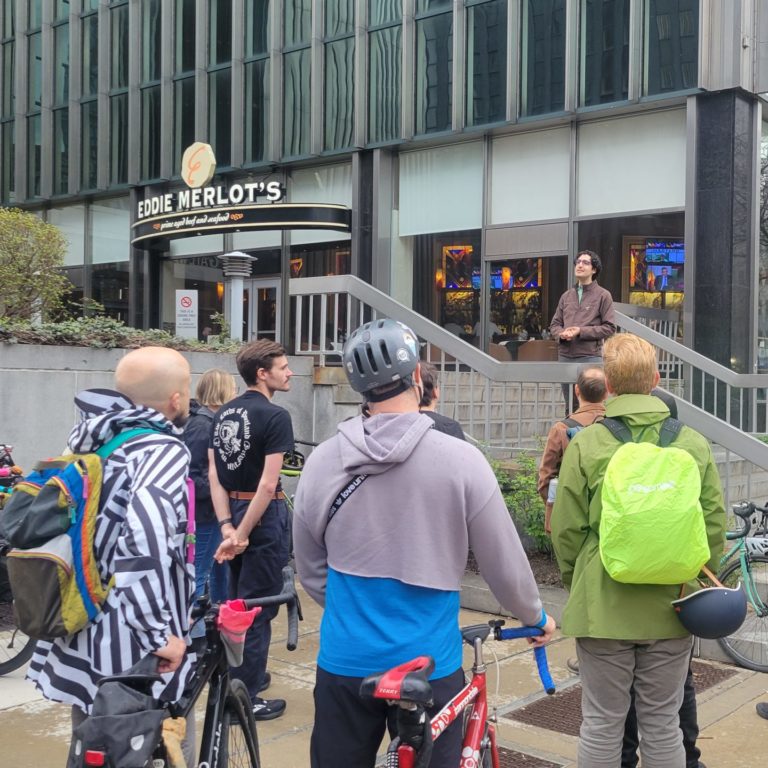
Getting to Zero
Tuesday, April 16, 2024
When it comes to eliminating traffic fatalities, the City, PDP and Downtown’s bike community won’t settle for anything less
…READ MORE
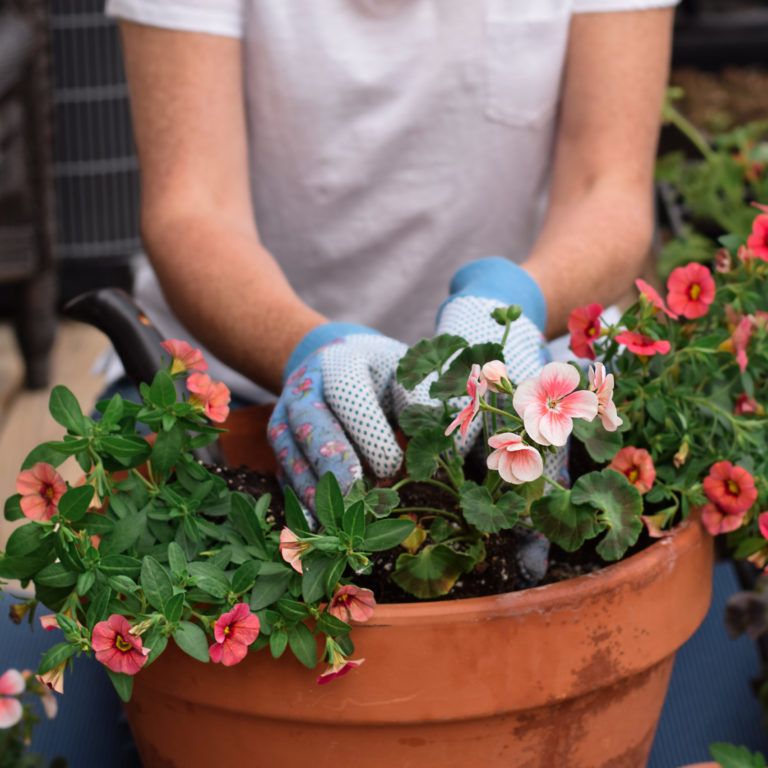
Help Us ‘Redd Up’ Downtown for the Summer!
Thursday, April 11, 2024
Volunteer with us for Redd Up Week, April 15 – 21!
DOWNTOWN DIRECTORY

About PDP

Join Our Mailing List
Downtown Made Easy Guide

Downtown Shopping Guide

State of Downtown Pittsburgh Report
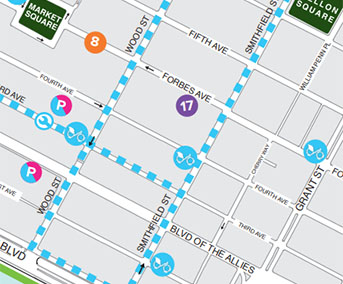
Downtown Map
Contact Us
412-566-4190
Email Us
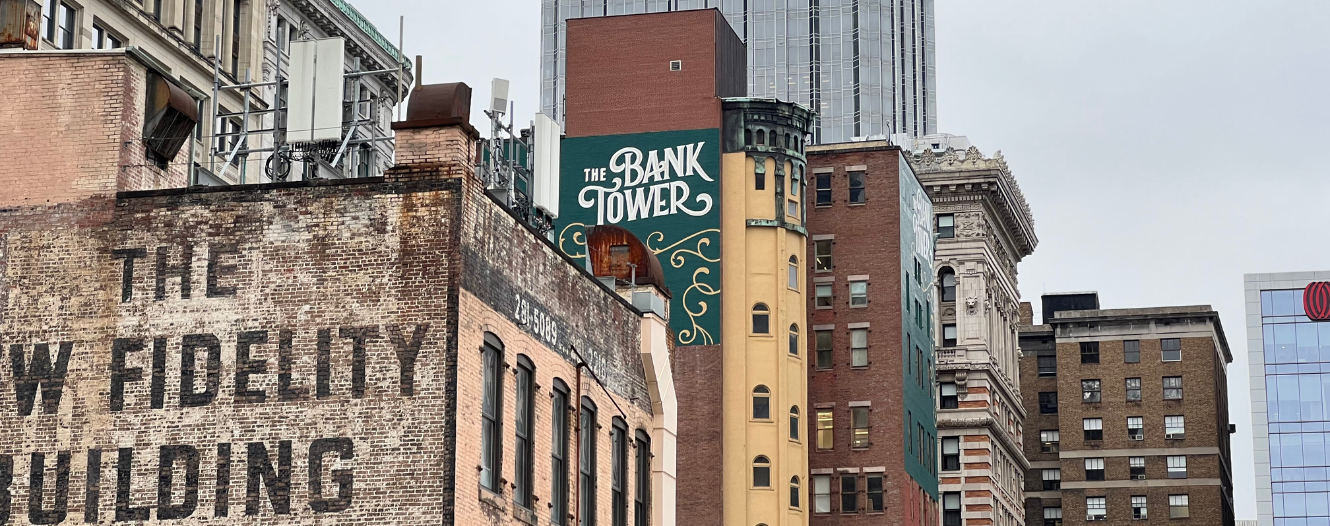
Pittsburgh Downtown Partnership
The Bank Tower
307 Fourth Avenue - Floor 2
Pittsburgh, PA 15222
© 2024 Pittsburgh Downtown Partnership. All Rights Reserved. | Terms Of Use | Privacy Policy